I am still playing with my Olimex STM32-P152 board: after connecting to its JTAG port with an FTDI cable and flashing it with OpenOCD, I wanted to debug a running program with GDB.
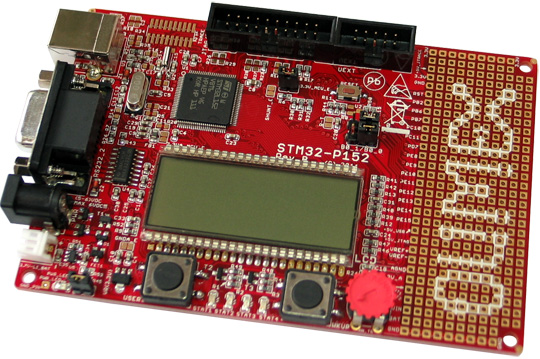
Olimex STM32-P152
The steps involved are:
- Requirements: Installation of needed software and hardware setup.
- Flashing: Building a simple program and writing it into the embedded flash.
- Debugging: Attaching to the running program.
Requirements
The things I need to complete my objective are (apart from the Olimex board):
- A Linux (Debian in my case) PC,
- OpenOCD version >= 0.6.0,
- ARM toolchain with both GCC and GDB: I use GCC ARM Embedded Toolchain
- A JTAG adapter: I am using a C232HM-EDHSL-0,
Since the requirements are the same as the last posts, we should refer to them to set up the environment. In summary the steps are:
- Install OpenOCD as explained in Flashing the STM32-P152 board with OpenOCD.
- Install the ARM toolchain as explained in Flashing the STM32-P152 board with OpenOCD.
- Connect the PC with the STM32-P152 (using the FTDI cable between the JTAG connector and an USB port) as explained in JTAG connection with OpenOCD and FTDI cable.
Flashing
The building and flashing of a program is similar to the Flashing the STM32-P152 board with OpenOCD post, with a couple of differences:
- Configure system to use the high speed clock.
- Add debug flags to compilation.
About the high speed clock, the STM32L152 starts with a slow clock, but has an internal clock that has a higher frequency. I noticed that the debug interface is more stable when using the high speed clock, so I wanted the program to configure it on startup. I took the “stm32l.cfg” file from Olimex website and wrote the same registers to switch to HSI clock inside the SystemInit function of the “blink.c” program that I created in Flashing the STM32-P152 board with OpenOCD, as follows:
...

#define RCC_CR REG32(RCC_BASE + 0x00)
#define RCC_CR_HSION 0x1
#define RCC_CR_HSIRDY 0x2
#define RCC_CFGR REG32(RCC_BASE + 0x08)
#define RCC_CFGR_SW 0x3
#define RCC_CFGR_SW_HSI 0x1

void SystemInit(void)
{
    uint32_t cfgr;

    RCC_CR |= RCC_CR_HSION; // Enable High Speed Internal clock
    while(!(RCC_CR & RCC_CR_HSIRDY)) // Wait for HSI ready
    {
        delay(10);
    }
    cfgr = RCC_CFGR;
    cfgr &= ~RCC_CFGR_SW;
    cfgr |= RCC_CFGR_SW_HSI; // Select HSI as system clock
    RCC_CFGR = cfgr;
    while((RCC_CFGR & RCC_CFGR_SW) != RCC_CFGR_SW_HSI) // Wait for HSI as system clock
    {
        delay(10);
    }
}

...
About the debug flags, it’s simply a matter of adding the “-g” option to GCC invocations, both in compiling and linking.
To summarize, the steps are:
- Copy the startup code “
startup_ARMCM3.S“ from ARM GCC toolchain directories as explained in Flashing the STM32-P152 board with OpenOCD. - Copy the linker script ”
sections.ld” from ARM GCC toolchain directories as explained in Flashing the STM32-P152 board with OpenOCD. - Create the main program “
blink.c” starting from Flashing the STM32-P152 board with OpenOCD and modifying SystemInit as written above. - Create the linker script “
stm32l152.ld” as explained in Flashing the STM32-P152 board with OpenOCD. - Write the OpenOCD configuration file ”
c232hm-edhsl-0.cfg” for the JTAG adapter as in JTAG connection with OpenOCD and FTDI cable. - Copy the OpenOCD configuration file “
stm32l.cfg“ for STM32L152 from Olimex website. - Write the OpenOCD script “
flash_blink.cfg“ as explained in Flashing the STM32-P152 board with OpenOCD. - Compile the program and flash it with the following commands:
$ arm-none-eabi-gcc -g -mthumb -mcpu=cortex-m3 -c -o blink.o blink.c
$ arm-none-eabi-gcc -g -c -o startup_ARMCM3.o startup_ARMCM3.S
$ arm-none-eabi-gcc -g -Tstm32l152.ld -Tsections.ld -mthumb -mcpu=cortex-m3 blink.o startup_ARMCM3.o    -o blink
$ arm-none-eabi-objcopy -O binary blink blink.bin
$ openocd -f c232hm-edhsl-0.cfg -f stm32l.cfg -f flash_blink.cfg
On the next boot from flash (a power-up or reset with boot jumpers placed in B0_0 B1_0 configuration) the STAT4 LED will start blinking at high speed.
Note that the blink executable is the file that we need to debug the program, and it’s important that the flashed program is the same as the one we use for debugging.
Debugging
Thankfully OpenOCD offers a GDB server, so that a debugger can connect to the target through it. By default OpenOCD opens a TCP/IP listening socket at port 3333, but OpenOCD manual alternatively suggest using pipes to connect. I wrote a configuration file, called “gdb-pipe.cfg“, with the following content:
gdb_port pipe
log_output openocd.log

$_TARGETNAME configure -event gdb-detach {
 echo "Debugger detaching: resuming execution."
 resume
}
The last lines register to the event where GDB is detached from OpenOCD and resume execution, so that when the user exits from GDB, the program continues to run and the LED starts blinking again.
For the debugger side, I prepared the following script of GDB commands, that I called “attach.cfg“:
target remote | openocd -f c232hm-edhsl-0.cfg -f stm32l.cfg -f gdb-pipe.cfg
monitor halt
monitor gdb_sync
stepi
The script executes OpenOCD and connects to it using a pipe, then halts the target and synchronizes with the GDB server. Note that the “monitor” commands are passed to OpenOCD directly. Now we can attach to the blink program:
$ arm-none-eabi-gdb blink -x attach.gdb
GNU gdb (GNU Tools for ARM Embedded Processors) 7.4.1.20130613-cvs
Copyright (C) 2012 Free Software Foundation, Inc.
License GPLv3+: GNU GPL version 3 or later <http://gnu.org/licenses/gpl.html>
This is free software: you are free to change and redistribute it.
There is NO WARRANTY, to the extent permitted by law.  Type "show copying"
and "show warranty" for details.
This GDB was configured as "--host=i686-linux-gnu --target=arm-none-eabi".
For bug reporting instructions, please see:
<http://www.gnu.org/software/gdb/bugs/>...
Reading symbols from /home/francesco/Projects/olimex-p152/blink/blink...done.
Open On-Chip Debugger 0.7.0 (2013-08-04-10:13)
Licensed under GNU GPL v2
For bug reports, read

http://openocd.sourceforge.net/doc/doxygen/bugs.html

Info : only one transport option; autoselect 'jtag'
adapter speed: 1000 kHz
adapter speed: 100 kHz
adapter_nsrst_delay: 100
jtag_ntrst_delay: 100
Warn : target name is deprecated use: 'cortex_m'
DEPRECATED! use 'cortex_m' not 'cortex_m3'
cortex_m3 reset_config sysresetreq
0x00000000 in ?? ()
target state: halted
target halted due to debug-request, current mode: Thread
xPSR: 0x21000000 pc: 0x08000116 msp: 0x20003fe8
stepi ignored. GDB will now fetch the register state from the target.

Program received signal SIGINT, Interrupt.
0x08000116 in delay (nops=27024) at blink.c:27
27	        nops--;
(gdb) list
22	void delay(int nops)
23	{
24	    while(nops > 0)
25	    {
26	        asm ("nop");
27	        nops--;
28	    }
29	}
30
31	static
(gdb) disassemble
Dump of assembler code for function delay:
   0x08000108 <+0>:	push	{r7}
   0x0800010a <+2>:	sub	sp, #12
   0x0800010c <+4>:	add	r7, sp, #0
   0x0800010e <+6>:	str	r0, [r7, #4]
   0x08000110 <+8>:	b.n	0x800011c <delay+20>
   0x08000112 <+10>:	nop
   0x08000114 <+12>:	ldr	r3, [r7, #4]
=> 0x08000116 <+14>:	add.w	r3, r3, #4294967295
   0x0800011a <+18>:	str	r3, [r7, #4]
   0x0800011c <+20>:	ldr	r3, [r7, #4]
   0x0800011e <+22>:	cmp	r3, #0
   0x08000120 <+24>:	bgt.n	0x8000112 <delay+10>
   0x08000122 <+26>:	add.w	r7, r7, #12
   0x08000126 <+30>:	mov	sp, r7
   0x08000128 <+32>:	pop	{r7}
   0x0800012a <+34>:	bx	lr
End of assembler dump.
(gdb) disconnect
Ending remote debugging.
(gdb) quit
So, the GDB command line client started and connected to the target, which was running in the delay function. It is possible to analyse the state and do the usual debugging. I also wanted to start debugging a program from the beginning, so I added a script called “run.gdb” that resets the core and breaks execution at main:
source attach.gdb
monitor reset halt
tbreak main
continue
The result when running the debugger with this script is that the target is reset, then a temporary breakpoint is set at the main function, then the program is resumed and eventually the execution stops at the beginning of main:
$ arm-none-eabi-gdb blink -x run.gdb
GNU gdb (GNU Tools for ARM Embedded Processors) 7.4.1.20130613-cvs
...
target state: halted
target halted due to debug-request, current mode: Thread
xPSR: 0x01000000 pc: 0x080002a8 msp: 0x20004000
Temporary breakpoint 1 at 0x800018c: file blink.c, line 49.
Note: automatically using hardware breakpoints for read-only addresses.

Temporary breakpoint 1, main () at blink.c:49
49	    RCC_AHBENR |= RCC_AHBENR_GPIOEEN; // enable GPIOE clock
(gdb)
It is also possible to use a graphical interface such as DDD, using for example:
$ ddd --debugger arm-none-eabi-gdb --command=run.gdb blink
And the result is shown in the following screenshot.

Debugging blink program running on STM32-P152 with DDD.
Conclusions
We have now a way to build and debug program for STM32-P152 at a very low level, using basic tools. I am aware that there are many integrated solutions using Eclipse or other IDEs, but I believe it’s important to know what’s happening below the surface, so that when problem arise, the developer can investigate the details and troubleshoot the situation very close to the hardware.
Filed under: Embedded Tagged: ARM, arm-none-eabi, arm-none-eabi-gcc, bare metal, c232hm, cortex-m3, ddd, debugging, flash, ftdi, gcc, gdb, gpio, jtag, linker script, microcontroller, olimex, openocd, stm32, stm32-p152, stmicroelectronics

